TechBridge 技術共筆部落格

var topics = ['Web前後端', '行動網路', '機器人/物聯網', '數據分析', '產品設計', 'etc.']

Udacity RoboND - Rover project 簡介


前言

最近 Udacity 的 nano degree 算是滿紅的,他們也有把很多教學資源放到 github 上面,例如 Rover project,我覺得拿來上手還不錯,以下就稍微來簡介一下這個 project 有趣的地方。

Project 簡介

Rover圖

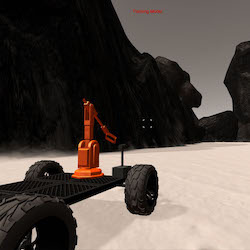
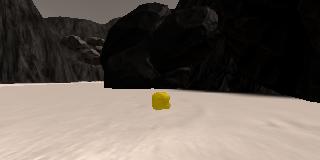
這個 project 是要讓 Rover 在世界中自由自在地行走,然後尋找特定的岩石樣本並收集,因為他們將岩石的顏色設計得跟背景很不一樣,所以我們只要可以在環境中走來走去,然後一直尋找畫面中有沒有黃黃的、像是黃金的石頭就好了:

sample

對收到的影像做處理,得到可以走的區塊

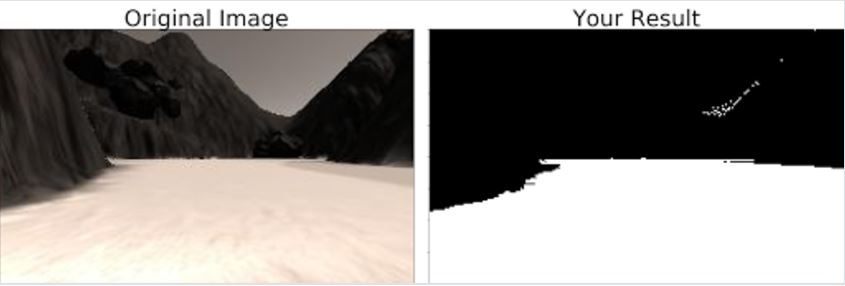
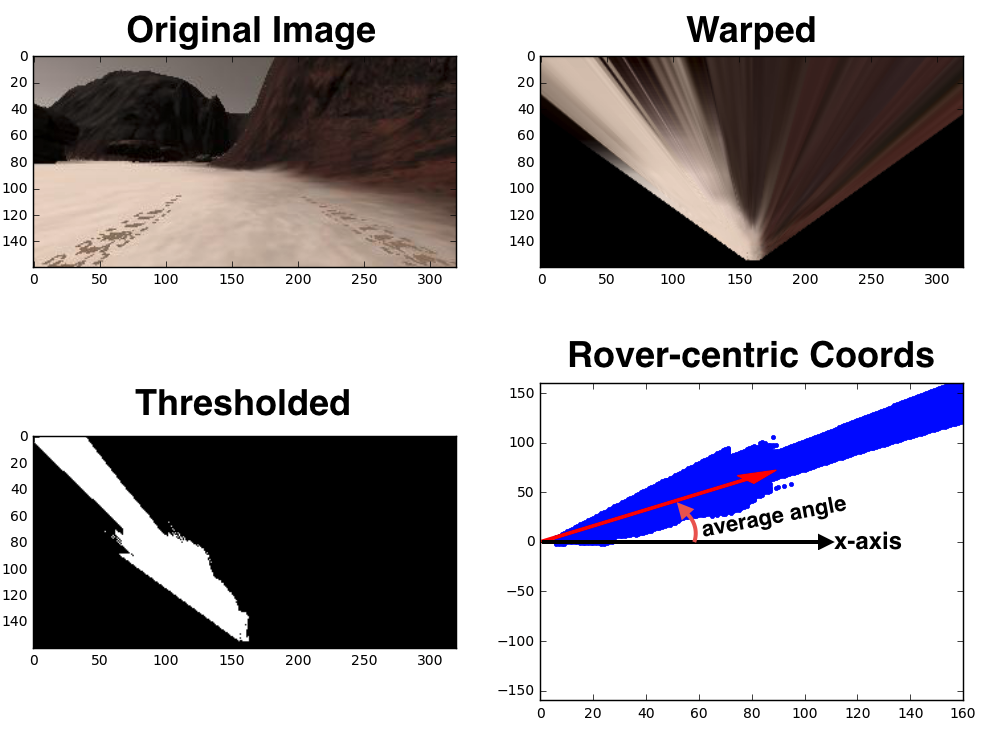
首先,機器人要知道哪邊可以走、哪邊不能走,所以在收到 camera 的影像後,要先處理一下,濾出可以走的區塊,

1
2
3
4
5
6
7
8
9
10
11
12
13
14
15
16
17
18
19
20
21
22
23
24
25
26
27
28
29
30
31
32
33
34
35
import matplotlib.pyplot as plt
import matplotlib.image as mpimg
import numpy as np

image_name = 'sample.jpg'
image = mpimg.imread(image_name)

# 因為可以走的區塊是白色的,使出color threshold大法
def color_thresh(img, rgb_thresh=(0, 0, 0)):
color_select = np.zeros_like(img[:,:,0])
above_thresh = (img[:,:,0] > rgb_thresh[0]) \
& (img[:,:,1] > rgb_thresh[1]) \
& (img[:,:,2] > rgb_thresh[2])
color_select[above_thresh] = 1

return color_select
red_threshold = 150
green_threshold = 150
blue_threshold = 150

rgb_threshold = (red_threshold, green_threshold, blue_threshold)

# pixels below the thresholds
colorsel = color_thresh(image, rgb_thresh=rgb_threshold)

# Display the original image and binary
f, (ax1, ax2) = plt.subplots(1, 2, figsize=(21, 7), sharey=True)
f.tight_layout()
ax1.imshow(image)
ax1.set_title('Original Image', fontsize=40)

ax2.imshow(colorsel, cmap='gray')
ax2.set_title('Your Result', fontsize=40)
plt.subplots_adjust(left=0., right=1, top=0.9, bottom=0.)
plt.show()

這樣就可以畫出結果了:

color

產生地圖

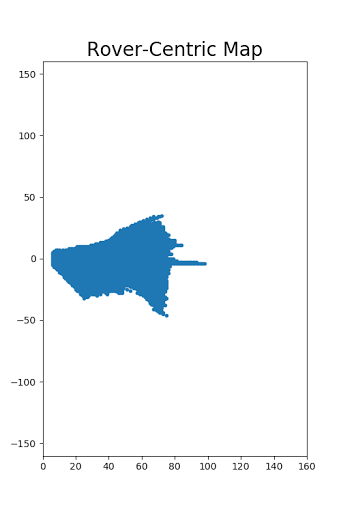
雖然我們從影像中,得知了目前可以走的區塊,但隨著機器人一直走來走去,就會得到一張張的影像,每張裡面都有可以走的區塊。如果可以把這一張張的影像接起來,變成地圖,那事情就會方便許多!所以我們可以透過 perspective transform 將影像變成從俯視的 view 觀看,然後再將影像轉換到以 Rover 為中心的坐標系就可以了。

1
2
3
4
5
6
7
8
9
10
11
12
13
14
15
16
17
18
19
20
21
22
23
24
25
26
27
28
29
30
31
32
33
34
35
36
37
38
import numpy as np
import cv2
import matplotlib.image as mpimg

def perspect_transform(img, src, dst):

# Get transform matrix using cv2.getPerspectivTransform()
M = cv2.getPerspectiveTransform(src, dst)
# Warp image using cv2.warpPerspective()
# keep same size as input image
warped = cv2.warpPerspective(img, M, (img.shape[1], img.shape[0]))
# Return the result
return warped
def color_thresh(img, rgb_thresh=(160, 160, 160)):
# Create an array of zeros same xy size as img, but single channel
color_select = np.zeros_like(img[:,:,0])
# Require that each pixel be above all thre threshold values in RGB
# above_thresh will now contain a boolean array with "True"
# where threshold was met
above_thresh = (img[:,:,0] > rgb_thresh[0]) \
& (img[:,:,1] > rgb_thresh[1]) \
& (img[:,:,2] > rgb_thresh[2])
# Index the array of zeros with the boolean array and set to 1
color_select[above_thresh] = 1
# Return the binary image
return color_select
image = mpimg.imread('sample.jpg')

dst_size = 5
bottom_offset = 6

# 這邊的定義是要給 perspective transform 用的,先定義原圖中的某些點,再定義想要扭成某個形狀的圖中那些點的位置
source = np.float32([[14, 140], [301 ,140],[200, 96], [118, 96]])
destination = np.float32([[image.shape[1]/2 - dst_size, image.shape[0] - bottom_offset],
[image.shape[1]/2 + dst_size, image.shape[0] - bottom_offset],
[image.shape[1]/2 + dst_size, image.shape[0] - 2*dst_size - bottom_offset],
[image.shape[1]/2 - dst_size, image.shape[0] - 2*dst_size - bottom_offset],
])
1
2
3
4
5
6
7
8
9
10
11
12
13
14
15
16
17
18
19
20
21
22
23
24
25
26
import matplotlib.pyplot as plt
import matplotlib.image as mpimg
import numpy as np
import cv2
from extra_functions import perspect_transform, color_thresh, source, destination

image = mpimg.imread('sample.jpg')

# 轉換到以 Rover 為中心的座標系
def rover_coords(binary_img):
y_pos, x_pos = binary_img.nonzero()
x_pixel = -(y_pos - binary_img.shape[0])
y_pixel = -(x_pos - binary_img.shape[1]/2 )
return x_pixel, y_pixel

# Perform warping and color thresholding
warped = perspect_transform(image, source, destination)
colorsel = color_thresh(warped, rgb_thresh=(160, 160, 160))
xpix, ypix = rover_coords(colorsel)

# Plot the map in rover-centric coords
fig = plt.figure(figsize=(5, 7.5))
plt.plot(xpix, ypix, '.')
plt.ylim(-160, 160)
plt.xlim(0, 160)
plt.title('Rover-Centric Map', fontsize=20)

綜合起來,就可以得到

warped_map

根據地圖產生新的移動方向

假設已經有了地圖,下一步就是希望得到要走的方向,最簡單的想法就是挑可以走的範圍的中線,因為離障礙物最遠。但我們前面的表示法,是把每個 pixel 用 (x,y) 這種笛卡爾坐標系下的定義來儲存位置,即便我們有這些可行走區域的 (x,y) 位置,要從這些 (x,y) pair 中找出中線還是頗麻煩的。

所以這邊就會用到小時候學過的極座標啦,大家可以想一想,如果我們有每一個可走區域的 pixel 的極座標,那是不是把每一個點的角度都平均一下,就可以得到要行走的角度了呢?

根據上面的觀念,我們就再寫一下從笛卡爾座標轉換成極座標的 function:

1
2
3
4
5
6
7
8
9
10
11
12
13
14
15
16
17
18
19
20
21
22
23
24
25
26
27
28
29
30
31
32
33
34
35
import matplotlib.pyplot as plt
import matplotlib.image as mpimg
import numpy as np
from extra_functions import perspect_transform, color_thresh, rover_coords

# 只要定義一個將pixel從笛卡爾座標轉成極座標的function就好
def to_polar_coords(xpix, ypix):
dist = np.sqrt(xpix**2 + ypix**2)
angles = np.arctan2(ypix, xpix)
return dist, angles

image = mpimg.imread('angle_example.jpg')
warped = perspect_transform(image) # Perform perspective transform
colorsel = color_thresh(warped, rgb_thresh=(160, 160, 160)) # Threshold the warped image
xpix, ypix = rover_coords(colorsel) # Convert to rover-centric coords
distances, angles = to_polar_coords(xpix, ypix) # Convert to polar coords
avg_angle = np.mean(angles) # Compute the average angle

# Plot
fig = plt.figure(figsize=(12,9))
plt.subplot(221)
plt.imshow(image)
plt.subplot(222)
plt.imshow(warped)
plt.subplot(223)
plt.imshow(colorsel, cmap='gray')
plt.subplot(224)
plt.plot(xpix, ypix, '.')
plt.ylim(-160, 160)
plt.xlim(0, 160)
arrow_length = 100
x_arrow = arrow_length * np.cos(avg_angle)
y_arrow = arrow_length * np.sin(avg_angle)
plt.arrow(0, 0, x_arrow, y_arrow, color='red', zorder=2, head_width=10, width=2)
plt.show()

就可以畫出下圖:

decision

總結

今天跟大家簡單介紹了一下 Udacity 的學習資源,也簡介了一點點 Rover project 的內容,我自己覺得他們的 project 設計都還不錯,值得玩一玩,適合想要入門的讀者參考。

延伸閱讀

  1. RoboND Kinematics Project
  2. RoboND Perception Project

關於作者:
@pojenlai 演算法工程師,對機器人跟電腦視覺有少許研究,最近在學習看清事物的本質與改進自己的觀念

喜歡我們的文章嗎?歡迎分享按讚給予我們支持和鼓勵!


訂閱 TechBridge Weekly 技術週刊,每週發送最精華的技術開發、產品設計的資訊給您


TechBridge Weekly 技術週刊編輯團隊

TechBridge Weekly 技術週刊團隊是一群對用技術改變世界懷抱熱情的團隊。本技術共筆部落格初期專注於Web前後端、行動網路、機器人/物聯網、資料科學與產品設計等技術分享。This is TechBridge Weekly Team Tech Blog, which focus on web, mobile, robotics, IoT, Data Science technology sharing.

關於我們 / 技術日報 / 技術週刊 / 粉絲專頁 / 訂閱RSS

留言討論